Research talk:Module storage performance
Add topicWorklog: Saturday, Nov. 23rd
[edit]This morning, I'm getting the data together from the logging tables.
> select count(*) from ModuleStorage_6356853;
+----------+
| count(*) |
+----------+
|  1463364 |
+----------+
1 row in set (13.10 sec)
It looks like I have about 1.4 million events logged. That's just about perfect. First things first. I'd like to get the first page load timings from the set for each browser. I think that I can just look for the first timestamp corresponding to an "experimentId" in order to get a good observation.
CREATE TABLE halfak.ms_indexed_load
SELECT
    *,
    1 AS load_index
FROM (
    SELECT
        event_experimentId,
        timestamp
    FROM
        ModuleStorage_6356853
    GROUP BY 1,2;
) AS first
INNER JOIN ModuleStorage_6356853 loads ON
    first.event_experimentId = last.event_experimentId AND
    first.timestamp          = last.timestamp;
CREATE INDEX id_timestamp ON halfak.ms_indexed_load;
I can use the above query to get all of the first page loads per user, but that's kind of limited. I can run a similar query to get the second page loads. I think that, instead, I'm going to write a quick script to iterate over the set and add an index field.
EpochFail 16:47, 23 November 2013 (UTC)
That took longer than expected.
> select event_experimentId, timestamp, load_index from ms_indexed_load where event_experimentId = "159073b12fa422" limit 3;
+--------------------+----------------+------------+
| event_experimentId | timestamp      | load_index |
+--------------------+----------------+------------+
| 159073b12fa422     | 20131120074237 |          0 |
| 159073b12fa422     | 20131120074457 |          1 |
| 159073b12fa422     | 20131120074542 |          2 |
+--------------------+----------------+------------+
3 rows in set (0.04 sec)
Sadly, I have to go have the rest of my Saturday now, but I'll pick this up again tomorrow morning. The next thing I want to do is produce a set of load time distributions based on load index. I'd also like to plot load time depending on the number of modules that needed to be loaded (miss count).
--Halfak (WMF) (talk) 17:55, 23 November 2013 (UTC)
Worklog: Sunday, November 24th
[edit]Back to hacking this morning. The first thing that I wanted to look at was how many of each load index we have.
> select load_index, count(*) from ms_indexed_load where load_index < 10 group by 1;
+------------+----------+
| load_index | count(*) |
+------------+----------+
|          0 |   381860 |
|          1 |   194407 |
|          2 |   126509 |
|          3 |    91286 |
|          4 |    69973 |
|          5 |    55928 |
|          6 |    46087 |
|          7 |    38510 |
|          8 |    32982 |
|          9 |    28468 |
+------------+----------+
10 rows in set (3 min 16.76 sec)
We're getting *way* higher load indexes than I thought. I suspect that the vast majority of loads would be "0", but we're getting a bunch of 1 and 2 as well. It will be nice to have this in a graph.
OK, but first, I need a sample. How am I going to create one? I'll want to stratify on a couple of interesting dimensions:
- event_experimentGroup
- load_index
So, I think that what I want to do is sample 5000 observations from the Nth load of each experimental group. That means I'm taking 20 samples @ 5000 = 100,000 observations. Alright R. Don't blow out my memory now.
Alright folks, it's time to let some pretty GG plot shine through.
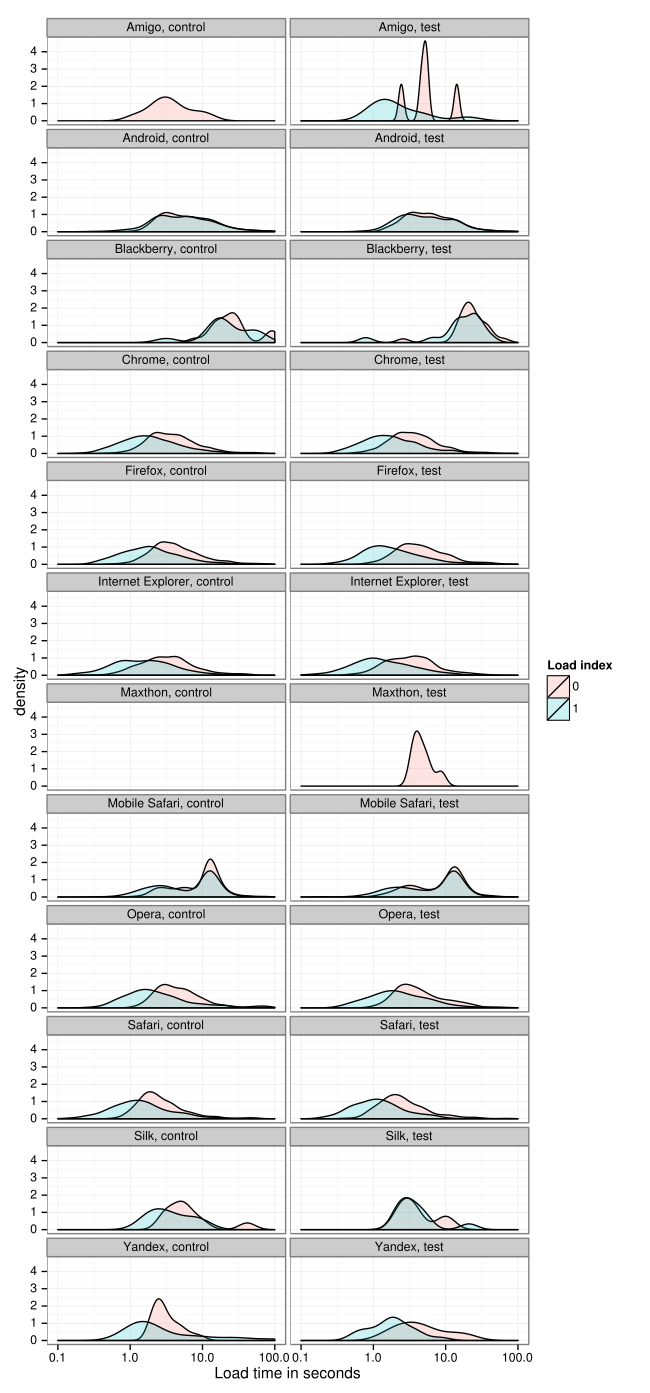
First up is a density plot. This plot shows how common certain load times are. Note that I've log scaled the X axis. These distributions look fairly log-normalish.
Note the strong offset of the first load to the right. It looks like the first load takes about 4 seconds regardless of whether you have module storage enabled. All subsequent loads (1-9) are centered around 1-2 seconds.
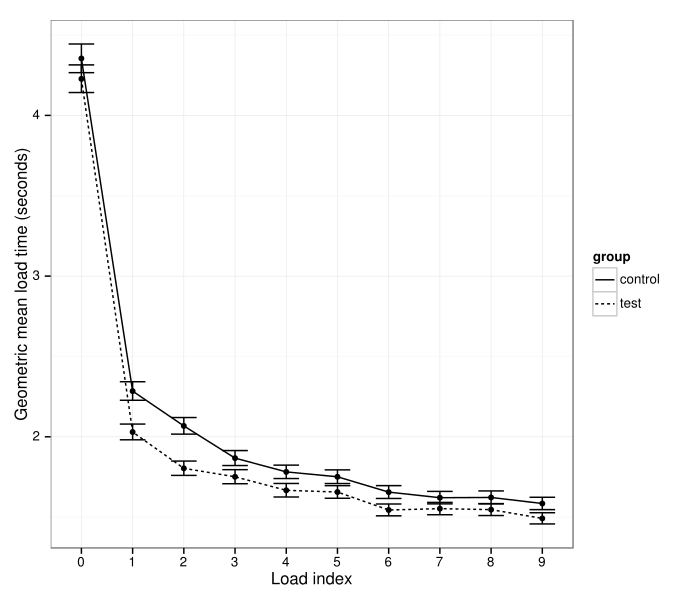
Next I want to check to see if there are differences between the two conditions. Since the data looks log-normal, a geometric mean should be an apt statistic to pull.
The test condition consistently wins out. Sadly, I have to cut myself off again this morning. I'll be back soon to write up these results into the main page. --EpochFail (talk) 17:29, 24 November 2013 (UTC)
Descending load times after the first load.
[edit]Descending page load times after index zero are weird. There are a few candidate explanations worth exploring here. One is that users who load more pages tend to have faster connections/computers. This can be checked by limiting the sample to readers who made at least 10 requests. This is my note to myself to look into this once I get a chance. --Halfak (WMF) (talk) 20:34, 25 November 2013 (UTC)
- A possible another explanation I am thinking, fwiw: the higher the load index is (i.e. the longer the user is browsing), the higher the likelihood of receiving modules updates is. In other words a candidate explanation (between others as yours) is the effect of updating modules. In the number this should reflect an increased difference between control and test over time, but the actual numbers don’t clearly show this trend.
- For the record, during this week, there were one MW deployment (1.23wmf4), five extensions deployments (BetaFeatures, MultimediaViewer, VectorBeta, CommonsMetadata, OAuth), one partial extension deployments (Echo on dewiki and itwiki), and two lighting deployments. It should be noted that the deployments during the experiment can influence all load index (depending if the user already visited the site before or after a given deployment), although it would problably influence more the load index 0, then 1, etc.
- ~ Seb35 [^_^] 09:24, 13 December 2013 (UTC)
Notes: Friday, Nov 29
[edit]Technical context
[edit]- Storager case study: Bing, Google
- App cache & localStorage survey
- Smartphone Browser localStorage is up to 5x Faster than Native Cache
- localStorage, perhaps not so harmful
- Module storage is coming, my e-mail to wikitech-l
Relevant changesets
[edit]- Id2835eca4: Enable module storage for 0.05% of visitors w/storage-capable browsers
- If2ad2d80d: Cache ResourceLoader modules in localStorage
- Ib9f4a5615: Controlled experiment to assess performance of module storage
Descending load times after the first load.
[edit]- Predictive optimization: "Chrome learns the network topology as you use it...the predictor relies on historical browsing data, heuristics, and many other hints from the browser to anticipate the requests."
- The higher the page view index, the more likely it is that there had been a previous page view in the same browser session, which means more page resources are available in RAM; a decreased likelihood of being affected by TCP slow-start; increased likelihood that a persistent connection had already been established prior to the current page view.
- In short: not very mysterious.
--Ori.livneh (talk) 11:01, 29 November 2013 (UTC)
Worklog: Friday, November 29th
[edit]The first thing I'd like to do this morning is figure out if different browsers are affecting the declining load time after index 2.
The first thing I'll need to do is limit the user-agents by OS and browser. Ori did a bunch of work for me by creating a table that simplifies the work for me, but there are still too many different browser versions and operating systems. For now, I'd like to deal with as few levels as possible.
> select left(browser, 6), left(platform, 6), count(*) from ms_indexed_load_with_ua group by 1,2 having count(*) > 1000;
+------------------+-------------------+----------+
| left(browser, 6) | left(platform, 6) | count(*) |
+------------------+-------------------+----------+
| NULL             | NULL              |    22591 |
| Amigo            | Window            |     1769 |
| Androi           | Androi            |    78927 |
| BlackB           | BlackB            |     4349 |
| Chrome           | Androi            |    31276 |
| Chrome           | Chrome            |     3652 |
| Chrome           | iOS 6             |     1320 |
| Chrome           | iOS 7             |     7528 |
| Chrome           | Linux             |     5550 |
| Chrome           | OS X 1            |    48247 |
| Chrome           | Window            |   582435 |
| Chromi           | Linux             |     1953 |
| Firefo           | Linux             |     9763 |
| Firefo           | OS X 1            |    16562 |
| Firefo           | Window            |   217513 |
| IE 10            | Window            |   102248 |
| IE 8             | Window            |    62455 |
| IE 9             | Window            |    51368 |
| Maxtho           | Window            |     1061 |
| Mobile           | Androi            |     1407 |
| Mobile           | iOS               |     1508 |
| Mobile           | iOS 4             |     1939 |
| Mobile           | iOS 5             |     9467 |
| Mobile           | iOS 6             |    31410 |
| Mobile           | iOS 7             |    82537 |
| Opera            | Androi            |     1704 |
| Opera            | Window            |    28644 |
| Safari           | OS X 1            |    60039 |
| Safari           | Window            |     1532 |
| Silk 3           | Linux             |     1491 |
| Yandex           | Window            |     6715 |
+------------------+-------------------+----------+
31 rows in set (4.97 sec)
Time to generate some new tables and re-draw my sample... EpochFail (talk) 16:35, 29 November 2013 (UTC)
OK. So I wrote a quick script to simplify the to the most common browsers and most common operating systems. Here is count of browser loads:
> select simple_browser, count(*) from ms_load_simple_ua group by 1;
+-------------------+----------+
| simple_browser    | count(*) |
+-------------------+----------+
| NULL              |    31469 |
| Amigo             |     1769 |
| Android           |    78927 |
| Blackberry        |     4349 |
| Chrome            |   680431 |
| Firefox           |   244479 |
| Internet Explorer |   216537 |
| Maxthon           |     1083 |
| Mobile Safari     |   126949 |
| Opera             |    31302 |
| Safari            |    61734 |
| Silk              |     1829 |
| Yandex            |     6803 |
+-------------------+----------+
13 rows in set (2.46 sec)
And here it is by OS (platform):
> select simple_platform, count(*) from ms_load_simple_ua group by 1;
+-----------------+----------+
| simple_platform | count(*) |
+-----------------+----------+
| NULL            |    27801 |
| Android         |   114554 |
| Chrome OS       |     3652 |
| iOS             |   136358 |
| Linux           |    20416 |
| OS X            |   125618 |
| Windows         |  1059262 |
+-----------------+----------+
7 rows in set (1.86 sec)
Now to figure out how to visualize the distribution of timing by browser/OS. --EpochFail (talk) 16:57, 29 November 2013 (UTC)
Lots of dimensions here even after I reduced them a bit. Some browsers very clearly benefit less from caching than others.
--EpochFail (talk) 17:40, 29 November 2013 (UTC)
For a quick reference, here are the median load times for load_index 0 and 1 (median_0 and median_1) respectively for each combination with more than 100 observations.
    platform           browser   group median_0  n_0 median_1  n_1    diff
 1:  Android           Android control   5661.0  327   5333.0  315  -328.0
 2:  Android           Android    test   5809.0  342   5342.0  311  -467.0
 3:  Android            Chrome control   4657.0  125   2814.5  110 -1842.5
 4:  Android            Chrome    test   3673.0  139   2884.0  125  -789.0
 5:      iOS     Mobile Safari control  11668.5  600  10713.5  540  -955.0
 6:      iOS     Mobile Safari    test  11420.0  592  10695.0  559  -725.0
 7:     OS X            Chrome control   2139.0  139   1453.0  137  -686.0
 8:     OS X            Chrome    test   1884.0  111   1191.0  133  -693.0
 9:     OS X            Safari control   2273.0  216   1313.0  195  -960.0
10:     OS X            Safari    test   2228.5  196   1121.5  198 -1107.0
11:  Windows            Chrome control   3652.0 1728   1717.5 1916 -1934.5
12:  Windows            Chrome    test   3479.0 1768   1583.0 1880 -1896.0
13:  Windows           Firefox control   3887.5  698   1881.0  669 -2006.5
14:  Windows           Firefox    test   4196.0  666   1624.0  669 -2572.0
15:  Windows Internet Explorer control   3120.0  777   1500.0  743 -1620.0
16:  Windows Internet Explorer    test   3302.0  759   1234.0  743 -2068.0
Curiously, it looks like the initial drop in load time is smaller for the test condition in most cases, but both the first and second loads are often faster for the test condition overall. This is really curious since I can't imagine why the initial load would be faster in the case of ModuleStorage.
--EpochFail (talk) 18:31, 29 November 2013 (UTC)
Now I want to know if the declining trend after the first load can be attributed to two hypotheses
- the type of user who tends to load more pages tends to have a faster connection
- Chrome's intelligent pre-fetching is improving performance over a set of page loads
To check the first hypotheses, I plotted the geometric mean load times for the experimental groups only for those users who complete at least 10 page loads.
The declining trend is still visible, but it seems to have been mostly washed out by enforcing this limitation. Hypothesis 1 seems like a good candidate explanation.
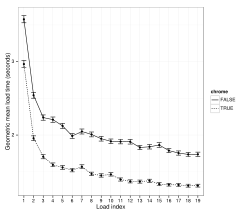
Next, I split load times by whether the browser was chrome or not.
Chrome users tend to load faster (note that this may be due to chrome users having faster internet connections -- which seems like a likely explanation), but load times decrease over subsequent page loads for both chrome and non-chrome browsers.
--EpochFail (talk) 18:48, 29 November 2013 (UTC)
Saturday, November 30th
[edit]As I was thinking about this work last night, I realized that the dataset was small enough that, with a little pain, I could load the whole set of load timings into memory rather than sampling down. This allows some cool things.
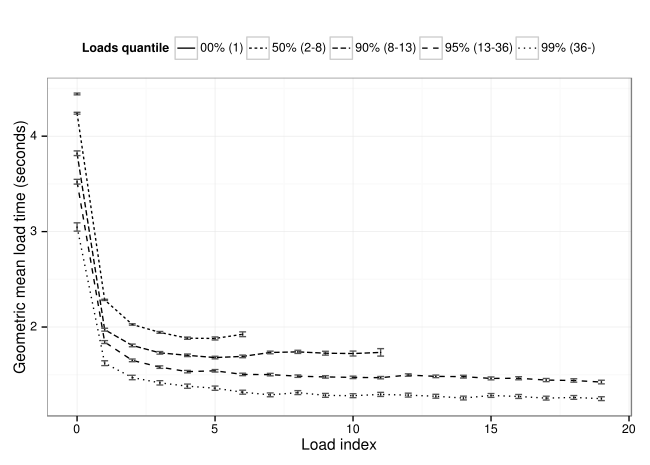
The plot below breaks readers into quantiles (0%, 50%, 90%, 95% and 99%) by the number of loads that we have recorded for them and then plots the mean (geometric) load times at each index. This gives a clear view into the users who load more pages are faster phenomenon.
There's one more thing that was bugging me. The plot above that breaks out browsers by their load times kinda sucks because some browsers don't have many observations in the sample. Let's fix that.
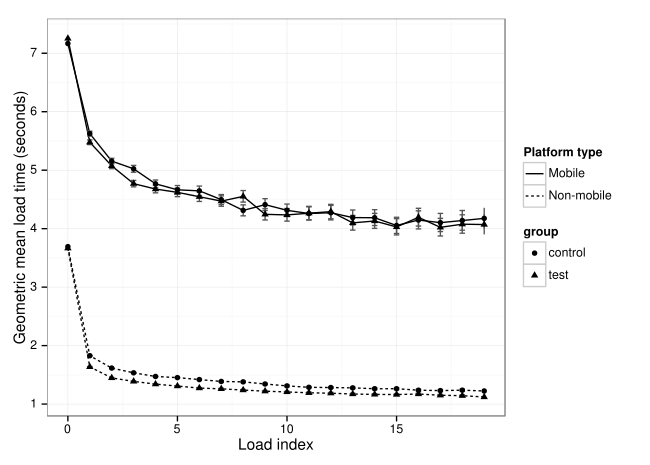
There's one really cool thing that you can pick out from this plot that you can't really see in the others. It doesn't look like browsers on mobile devices end up getting any really performance boost from caching in either the control or the test conditions. Wow! --EpochFail (talk) 17:19, 30 November 2013 (UTC)
OK one more thing before I start writing up these results in a consumable format. I wanted to see if it looked like caching was working AT ALL for mobile, so I replicated the load index plot but divided the observations between mobile and non-mobile browsers.
OK. Time to start writing. --EpochFail (talk) 17:37, 30 November 2013 (UTC)
Impact of performance
[edit]Fantastic work, Aaron! This is really fascinating. I'm dumping a couple of links to blog posts summarizing findings from various companies about the impact of performance. The most robust study is from Aberdeen Group, who looked at over 160 organizations and determined that an extra one-second delay in page load times led to 7% loss in conversions and 11% fewer page views. link (paywall, yuck!). These two blog posts survey additional findings from Google and Bing:
--Ori.livneh (talk) 19:07, 30 November 2013 (UTC)
Differential updates
[edit]DynoSRC does something similar, but it decreases update size even further by diffing it against the old version... might be of interest. --Tgr (WMF) (talk) 21:49, 6 December 2013 (UTC)
Work log: Wednesday, February 15th
[edit]We're back after running a new experiment post bug fix. I have a week's worth of new data and it's time to see how different things look.
First of all, I took a sample of data last time. I'd like to not sample the data this time, so I think that I'm going to try to load all 3.6 million rows into R.
> SELECT count(*) FROM ModuleStorage_6978194 WHERE event_loadIndex <= 100;
+----------+
| count(*) |
+----------+
|  3688143 |
+----------+
1 row in set (1 min 29.97 sec)
--Halfak (WMF) (talk) 00:14, 16 January 2014 (UTC)
Still working to get the data in R. Things are shaped a little different than they were last time (due to some improvements in our logging), so I needed to work on getting the data aggregation worked out. One of the things that I need to do is extract OS and Browser from the User Agent. Luckily, python has a nice library for it. See https://pypi.python.org/pypi/user-agents/. --Halfak (WMF) (talk) 00:56, 16 January 2014 (UTC)
It's getting late, so I'm going to dump some plots and state my take-away. First, I didn't end up pulling in the whole 3.6 million observations. It turns out that the user agent info extractor is super slow, so I randomly sampled 10k at each load index between 1 and 19.
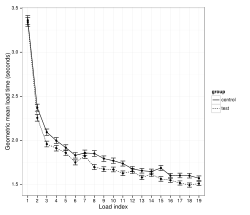
It looks like Module Storage (experimental) is outperforming the control. I still need to do some work to split up mobile and desktop browser/environments, but the results look very clear. --Halfak (WMF) (talk) 02:54, 16 January 2014 (UTC)


