Research:Community portal redesign/Opentask
The purpose of this experiment is to measure the effects of modifications to the open task list on the Community portal on English Wikipedia.
Background
[edit]The Community portal attracts thousands of visitors each day, the majority of whom are anonymous and new editors. A relatively high percentage of these users click on articles in the open task list, which is refreshed hourly by a bot with articles from various maintenance categories.
While we know how many users are clicking on these articles, we don't have a good sense of how many of them are attempting and/or completing an edit. Qualitative coding of a day's worth of data suggests that few to no edits emerge from these visits. Measuring the number of task attempts and completions in a discrete period of time will give us a good baseline for other task recommendation focused experiments, as well as provide insight for iteratively improving the usability of this and other task recommendation lists.
| Extended content | ||||||||||||||||||||||||||||||||||||||||||||||||||||||||||||||||||||||||||||||||||||||||||||||||||||||||||||||||||||||||||||||||||||||||||||||||||||||||||||||||||||||||||||||||||||||||||||||||||||||
|---|---|---|---|---|---|---|---|---|---|---|---|---|---|---|---|---|---|---|---|---|---|---|---|---|---|---|---|---|---|---|---|---|---|---|---|---|---|---|---|---|---|---|---|---|---|---|---|---|---|---|---|---|---|---|---|---|---|---|---|---|---|---|---|---|---|---|---|---|---|---|---|---|---|---|---|---|---|---|---|---|---|---|---|---|---|---|---|---|---|---|---|---|---|---|---|---|---|---|---|---|---|---|---|---|---|---|---|---|---|---|---|---|---|---|---|---|---|---|---|---|---|---|---|---|---|---|---|---|---|---|---|---|---|---|---|---|---|---|---|---|---|---|---|---|---|---|---|---|---|---|---|---|---|---|---|---|---|---|---|---|---|---|---|---|---|---|---|---|---|---|---|---|---|---|---|---|---|---|---|---|---|---|---|---|---|---|---|---|---|---|---|---|---|---|---|---|---|---|
Week 1[edit]Click results[edit]
Week 2[edit]Click results[edit]
(50% increase from week 1)
Week 3[edit]Click results[edit]
|
Measuring the funnel
[edit]
Funnels are ways of measuring user conversion through multiple steps and tasks. We're interested in how many unique users who view the landing page go on to view and attempt one of the tasks. Additionally, we're interested in seeing what kinds of tasks most users are attempting, and whether they successfully save their edits to those task articles.
| Event | Definition | What's tracked | Properties |
|---|---|---|---|
| Opentask click | User clicks on any article in the open task section of the Community portal | anonymized token, timestamp, click target | task type (e.g., "copyedit," "npov", etc.) |
| Edit click | User clicks on the edit button of the task page | anonymized token, timestamp, click target | task type |
| Edit completion | User closes the editing interface either through a successful save or cancel action | anonymized token, timestamp, click target | save, task type |
| CP return | User returns to the CP after passing through any stage of the funnel | anonymized token, timestamp, click referrer | none |
Results
[edit]- Pre-redesign (November 3-14)
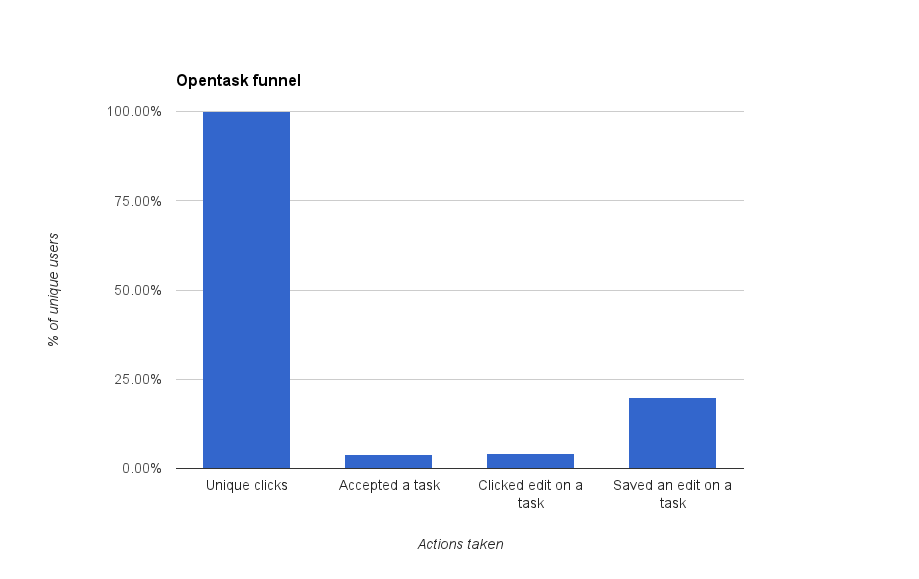
The above chart shows unique users converted along each of the following steps: 1) clicking any link on the Community portal, 2) clicking on an opentask link (accepting a task), 3) clicking the edit button on the article, 4) saving an edit to the article. Except for the first column, each column is the percentage of users converted from the previous step (the number of users who completed that step divided by the number of users who completed the step to the left).*
*Absolute numbers: 3239 users accepted a task, 136 clicked edit, 27 saved edit.
It appears that the major drop-off point in the funnel is between accepting a task (clicking on one of the articles in the opentask list) and finding/clicking the edit button. This suggests that users are interested in trying out a task, but either don't find the edit button or can't figure out how they can improve the article.
- After the redesign (November 15-26)
*Absolute numbers: 1193 users accepted a task, 56 attempted an edit, and 19 saved. This represents a small increase (from 4% to 5%) for edit attempts, and a larger increase (from 0.1% to 2%) of successful saves per click-through to task.
Conversion by task
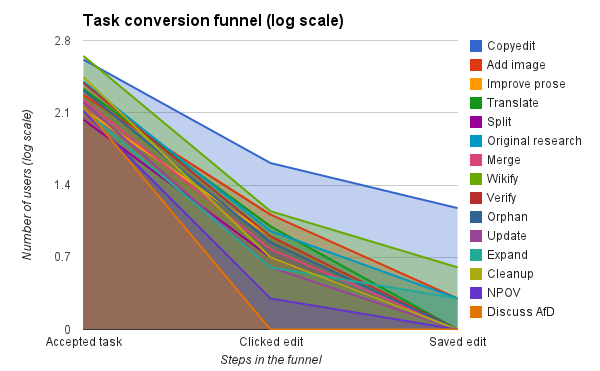
[edit]The above image shows absolute numbers of unique users selecting, attempting, and completing the different kinds of tasks in the opentask list. Copyediting and wikifying appear to be the two most successful task types, measured by both numbers of users selecting articles in those task types and successfully editing the articles.
Clicks and conversions
[edit]The following is a heatmap of clicks on the different sections of the opentask list, and a table of unique users who passed through different stages of the funnel and the percentages that completed each stage (except task, edit article, save edit) in a 10-day period. The top two task types, wikifying and copyediting, received a fourth of all the clicks on the list. However, only copyediting was able to convert a significant number of users.
- Heatmap of clicks
| Task type | # of unique users who accepted at least once | # of users who clicked on the edit button | % converted | # of users who saved an edit | % converted |
|---|---|---|---|---|---|
| Improve prose | 136 | 8 | 6% | 0 | 0 |
| Copyedit | 412 | 41 | 10% | 15 | 37% |
| Wikify | 447 | 14 | 3% | 4 | 29% |
| Discuss AfD | 144 | 0 | 0 | 0 | 0 |
| Translate | 214 | 10 | 5% | 0 | 0 |
| Merge | 167 | 6 | 4% | 1 | 17% |
| Split | 108 | 5 | 5% | 0 | 0 |
| Verify | 245 | 8 | 3% | 0 | 0 |
| Update | 159 | 4 | 3% | 0 | 0 |
| Cleanup | 279 | 5 | 2% | 1 | 20% |
| Orphan | 207 | 7 | 3% | 0 | 0 |
| Expand | 136 | 4 | 3% | 2 | 50% |
| Add image | 187 | 13 | 7% | 2 | 15% |
| NPOV | 130 | 2 | 2% | 0 | 0 |
| Original research | 252 | 9 | 4% | 2 | 22% |
| Total | 3239 | 136 | n/a | 27 | n/a |


