Education/News/November 2022/WikiGraphers: Visualizing Open Knowledge
WikiGraphers: Visualizing Open Knowledge

In this visual era, when people perceive information through images, especially graphical images (for example, the popularity of anime and the culture of communication through GIFs and emojis), it is necessary to package the knowledge in line with the needs and requirements of the time. Illustrations, including graphics, infographics, animations, and maps, transform a large amount of complex information into easy-to-understand, clear, and attractive knowledge. Illustrations make data-driven knowledge more user-friendly, boost subject awareness and increase engagement.
For years, the Armenian Wikipedia has been one of the dynamically developing online encyclopedias in the region. During these years, several events and projects have been initiated to develop the textual content of the Armenian Wikipedia. However, despite the increase in the number of articles, mainly due to the translation of the foreign language Wikipedias, the visual representation of these articles remained unimproved.

Being Armenian Wikipedia active editors, who have faced this problem for years, we thought of initiating a project, the primary goal of which would be the creation of visuals for Armenian Wikipedia using innovative tools and methods. In addition, this project would lay the foundation for creating a new direction in the wiki movement: the community of WikiGraphers.
Working in Armenia’s leading investigative and multimedia school, Hetq Media Factory, we had all the necessary resources and experience to develop and effectively implemented our “WikiGraphers: Visualizing Open Knowledge” project. It has been three years since Hetq Media Factory educates 30 students a year with different educational backgrounds and skills. Having a carefully-designed educational plan based on the “learning by doing” method helped us to design the new project curriculum where all our students would be successfully involved in the educational process, regardless of their initial knowledge base.
One of the motivations for implementing the project was that enriching Wikipedia articles with visually compelling elements would encourage readers to spend more time on Wikipedia, and obtain, contribute and share more content.
Within the framework of the project, twenty students learned modern visualization tools over eight months and used the acquired skills to visualize Wikipedia articles. The educational process is based on learning four subjects: “Wiki Ideology and Wiki Editing” course, during which the students learn about the ideology of the Wikimedia movement, its values, Wiki Markup, wiki editing rules, and guidelines. During the “Illustration/Animation” course, the students learn to create graphical images and animations. Wikipedia articles are full of numerical data from various sources. Thus, the students learn to create infographics during the “Creation of Data-Driven Infographics” course. Nowadays, maps and satellite images contain vast amounts of information about water resources and the ecological and geographical characteristics of the location. The “GIS Mapping” course teaches the students QGIS open-source software to be able to visualize geographical data and enrich Wikipedia articles with maps and geoinformation.
In the sixth month of the education process, students uploaded more than 300 of the visuals they created. By the end of the program, students will have at least 200 more visuals uploaded to the Wikimedia Commons.
One of the project’s priorities is also the integration of WikiGraphers into the wiki community. For this purpose, at the end of the project’s first phase, a Hackathon was organized in Dilijan to bring together active and experienced Wikipedians and project participants in one place. Furthermore, the Hackathon aimed not only to create new visuals and thus update the content of the articles but also to ensure networking between Wikipedians and project participants, sharing experiences, and to create an environment that would encourage further collaboration between them.
-
EU Countries as per Annual GDP
-
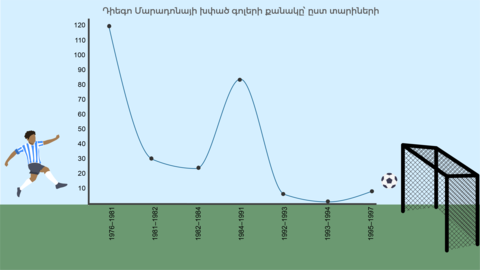
Number of goals scored by Diego Maradona by year
-
Process of Photosynthesis


