Research:Editor Lifecycles
Our main research goal was to understand the health of Wikipedia. This general ambition gave rise to several specific questions: What are the work patterns of Wikipedia users? How do users change as they become more experienced? How do user patterns change as Wikipedia becomes older? Throughout analyses involving different measures of time spent on Wikipedia and edits to Wikipedia, our findings demonstrate that editors typically do not actively continue editing for more than a year. For those who do, as these users mature as editors, they tend to gravitate toward editing popular namespaces more often. Also, editors who continue to edit for longer amounts of time are those who contributed the most to Wikipedia from the very beginning. This finding is consistent with the results of Panciera et al. in Wikipedians Are Born, Not Made: A Study of Power Editors on Wikipedia.[1]
IMA MAXIMA
[edit]This page documents the Wikipedia research of the IMA (Institute for Mathematics and its Applications) MAXIMA Interdisciplinary Research Experience for Undergraduates participants Alexander Bristol, Mary Katherine Huffman, Nathan Leech, and Guanyu Wang along with mentors Shilad Sen and Paolo Codenotti.
These researchers gathered Wikipedia data from 2001 to the beginning of 2012; however, some analyses only include data from 2003 to 2012.
Definitions
[edit]Offset: the number of years between the year of a certain edit made by a user and the year of this user's first edit
Tenure: the length of time a user has been active on Wikipedia
Cohort: the year of a user's first edit on Wikipedia

Research Methodology
[edit]We addressed our research questions through a four-step process. We developed our own behavioral hypotheses by means of previous research and preliminary plots. We identified features and user characteristics that might correspond to these behaviors. For example, perhaps more active editors have more edits in more namespaces. We then extracted data from the full-revision-text dump of Wikipedia with Amazon's Elastic Map Reduce. Using Python and R, we translated this data into numerical information, such as tenure of a user. Finally, we created graphs, plots, and models to visualize and explain our findings.
Approaches and Results
[edit]New Users and First Years
[edit]Inspired by the desire to measure the health of Wikipedia, we first investigated any decline in initial usage, such as decreasing edits to Wikipedia as a whole over the years.
Our first analysis plotted the one-year survival probability of a user who enters in a given year. Survival probability is defined as the probability that a user makes an edit in the year following his or her first edit. Letting X denote the year of a first edit for a user, this probability is:
Figure 1. shows the survival probability for the users of each entry year. The likelihood that a user will survive past his or her first year continues to decrease throughout recent years.

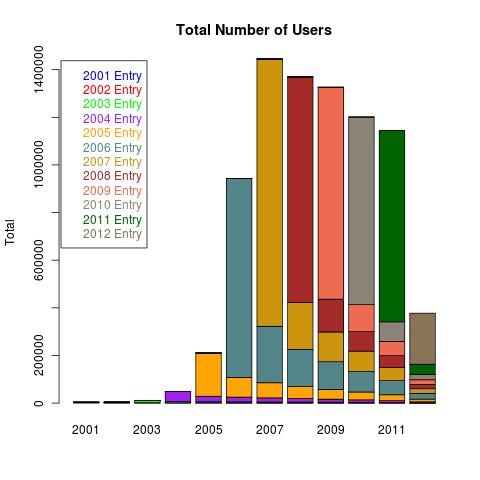
Figure 2. displays the total number of editors in Wikipedia each year, divided into cohorts by colors. This plot shows that the new users of each year make up the majority of total users for that year. Perhaps Wikipedia is becoming less popular or perhaps the enormous amount of information on Wikipedia does not allow for as many edits as in its earlier years.
Work Metrics
[edit]We examined two measures of work on Wikipedia: number of edits and number of hours. Finding edit counts was straightforward, but there was no way to know the edit duration for every edit, since we were only given one timestamp per edit.
Model Motivation
[edit]With the edit timestamps, we were only able to calculate the time between edits in a session, defined as a series of edits without a period of over sixty minutes of inactivity. We assumed this value to be the edit duration. Unfortunately, we did not have information regarding the time a user takes to make his or her first edit in a session. Imagine a user who made edits yesterday at 10:30am, 10:45am, and 12:50pm. We assume that the first two edits were completed in a session with a length of 900 seconds (15 minutes). However, due to the time between the last two edits, we do not assume these were made in the same session. To predict the time of an edit such as this, we created a linear model with the statistical tool R.
Model Construction
[edit]We sampled approximately 1 million edits at random out of over 200 million. Our data includes some duplicate users, but no duplicate edits.
A histogram of the inter-edit times for these 1 million edits was created to see if our data was normally distributed. Because of the right skew with a tail toward longer inter-edit times, we decided to truncate the data at 750 seconds. Times ranging from 0 to 750 seconds included approximately 90% of the original data, and any time that was longer than 750 seconds was set to 750. Afterward, our data appeared closer to a normal distribution.
Using R, we created an additive model with the truncated inter-edit time as the dependent variable and namespace, log of bytes added plus one (in case of zero bytes), log of bytes subtracted plus one, log of total bytes changed plus one, cohort, and offset as explanatory variables. Using the log of the bytes information is a type of data transform, a technique in statistics used to make the data better fit the assumptions and to make the interpretation clearer. Let the following variables be defined as:
The regression yielded the following equation:
The coefficient used for a namespace is dependent upon that particular namespace. Using the Main namespace as the level for the model, the individual coefficients are:
| Namespace | Coefficient | Namespace | Coefficient |
|---|---|---|---|
| Main | 0.00 | Talk | -36.76 |
| Book | -27.04 | Book Talk | -117.57 |
| Category | -95.41 | Category Talk | -163.22 |
| File | -45.66 | File Talk | -125.10 |
| Help | 77.66 | Help Talk | 82.33 |
| Mediawiki | 116.21 | Mediawiki Talk | 17.66 |
| Portal | -39.17 | Portal Talk | -102.13 |
| Project | -0.13 | Project Talk | 47.14 |
| Template | -24.92 | Template Talk | -15.22 |
| User | 8.58 | User Talk | -103.82 |
Model Interpretation
[edit]Our model indicates that work in different namespaces takes varying amounts of time. For example, according to this model, a user working in the Mediawiki namespace will take much longer between edits than a user working in the File namespace. We assume this has much to do with the nature of each namespace. Mediawiki is used for administrative work, which could potentially take a great amount of time, while the File namespace is used for uploading images, which takes significantly less time.
Our model also claims that adding bytes takes about seven times as long between edits as subtracting bytes. We conclude that giving one's own input takes much more time, debate, and concentration than deleting another's.
Finally, the variables offset and cohort also provide us with interesting suggestions. The model suggests that as offset increases, time between edits decreases. This makes sense to us, since it is logical that the more time a user spends on Wikipedia, the faster he or she might likely becomes at making edits. Similarly, this model indicates that the later one joins Wikipedia, the longer he or she takes between edits.
How Do Our Metrics Differ?
[edit]After creating our model, we were able to predict the duration for the first edit of a session, and we then added this new data to the edit durations we had already obtained.
In order to see if the predictions of our model were valid, we compared plots of time proportions with and without the predicted data. Our work proportion is defined as:
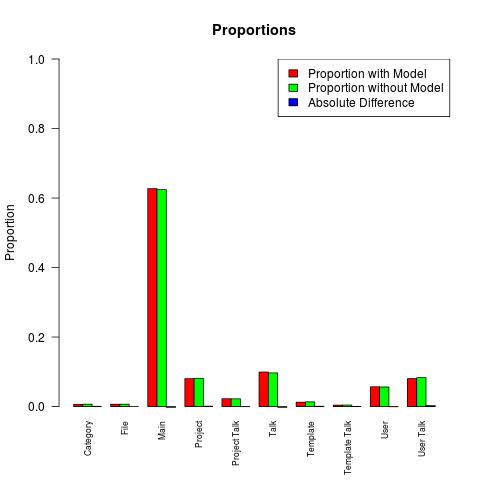
The largest discrepancy in proportion was less than 0.003 between the two User Talk namespace values, which justified the model. See Figure 3. below for a visual representation of these proportions for a few select namespaces.
We also compared edit proportions to the time proportions (with model predictions) . Below is a table displaying rounded values of the time proportion without the model, the time proportion with the model, edit proportion, the difference between time proportion with the model and edit proportion (also easily visualized in Figure 4.), and the percent change between time proportion and edit proportion. A negative percent change indicates less time per edit in the given namespace.
| Namespace | Time Proportion without the Model | Time Proportion with the Model | Edit Proportion | Difference | Percent Change |
|---|---|---|---|---|---|
| Category | 0.0067 | 0.0060 | 0.0100 | -0.0040 | -40.0% |
| File | 0.0068 | 0.0067 | 0.0076 | -0.0009 | -11.84% |
| Main | 0.6245 | 0.6271 | 0.6695 | -0.0424 | -6.33% |
| Project | 0.0813 | 0.0803 | 0.0566 | 0.0237 | 41.87% |
| Project Talk | 0.0221 | 0.0226 | 0.0118 | 0.0108 | 91.53% |
| Talk | 0.0968 | 0.0992 | 0.0868 | 0.0124 | 14.29% |
| Template | 0.0135 | 0.0125 | 0.0151 | -0.0026 | -17.22% |
| Template Talk | 0.0043 | 0.0041 | 0.0032 | 0.0009 | 28.13% |
| User | 0.0562 | 0.0569 | 0.0449 | 0.0120 | 26.73% |
| User Talk | 0.0833 | 0.0803 | 0.0879 | -0.0076 | -8.65% |
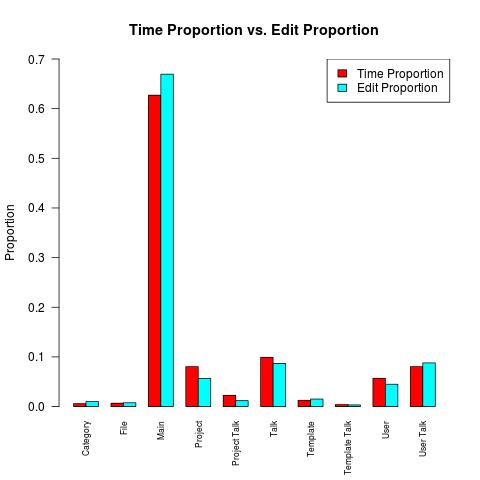
The difference between edit and time proportions was significant enough that we look at both metrics throughout our research.
Lifecycle Comparisons
[edit]We compared many different representations of edits done and time spent on Wikipedia, such as raw work, proportions, average proportions for users, and tenure separated work.
Raw Work and Proportions
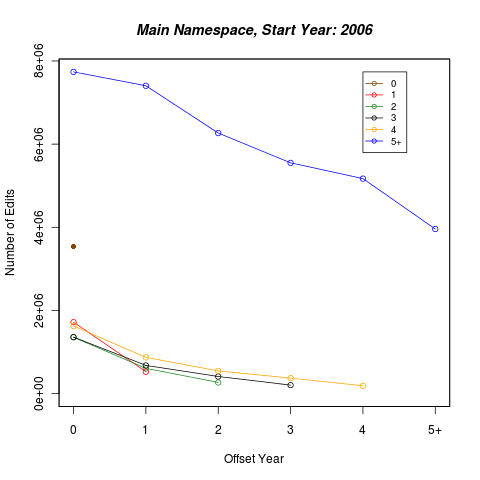
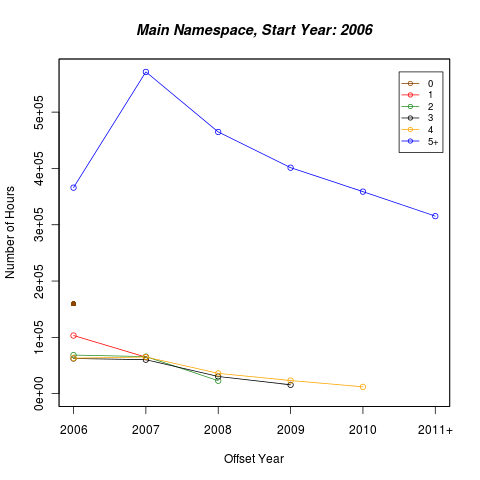
[edit]We were interested in seeing where Wikipedia users were choosing to make most of their edits versus where they were spending the most time. We first separated users into cohorts and plotted the raw number of edits and hours made to a namespace each year after entry.
Both of the graphs have an overall decrease, but most noteworthy is that time generally increases after the first year for early cohorts, whereas the number of edits decreases.
Since raw counts are hard to compare when looking at multiple namespaces, we separately plotted the work proportions to each namespace each year after entry. We used the work proportions defined in the previous section for all 20 user-edited namespaces.
We noted that in general, each cohort tends to decrease in number of edits to a namespace; however, in certain namespaces, the proportion graph is U-shaped. We hypothesize that users are leaving these early popular namespaces to contribute elsewhere or new users are simply more likely to edit certain namespaces.
King of All Vext Fans
[edit]While much of our information seemed logical, we did notice extremely unusual activity in the Category Talk namespace. Specifically, there was a 100,000+ edit jump from 2009 to 2010 in the 2005 cohort, and no other point on the graph was higher than 50,000. Fearing a mistake, we ran through our data to look for edits from this suspicious cohort. We found a shocking amount of edits from user Koavf (King of All Vext Fans). After doing some brief research, we discovered that on April 18, 2012, he was the first user to reach one million edits. In 2010, his 134,811 edits in Category Talk accounted for 57.22% of the total edits in that namespace for that year. This case inspired us to devise methods and graphs that would prevent such data from skewing our results.

Average Proportions
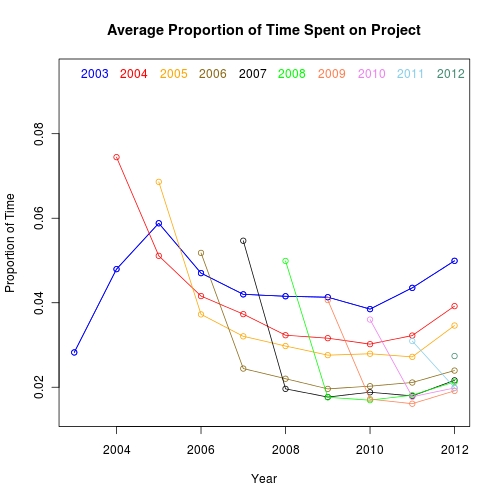
[edit]When reviewing the data of raw edit counts and edit proportions, we noticed skewed information due to the most active users (see subsection King of All Vext Fans). To give us a clearer picture of a typical user and their contributions to one namespace versus another, we decided to average the proportions of both edits and time. We first calculated the proportion of edits/time done to each namespace by each user and averaged these for each cohort and offset group. We then made graphs for each namespace, which contain plotted lines representing each cohort.
Our data for the Main namespace (Figures 5A and 6A above) mostly matched our intuition. For every cohort (excluding 2003), there is a general increase in the average proportion of both time and edits throughout the years. This is probably due to a decrease in the need to edit namespaces like User. It makes sense that as users become more experienced, they edit Main more frequently than other namespaces. However, we did expect a decrease in the proportion for each cohort during their later years, thinking that users may start to edit Project more, or also frequent different Talk pages. The 2007 - 2010 cohorts are the only ones that show a decrease, and only between 2011 and 2012. Each decrease is less than one percent, and it is important to point out that these cohorts have the highest proportions of the chart. Thus, it is not surprising to see an insignificant decrease.
As for the differences between time and edits, the proportion of time is steadily less than edits, though the increase throughout the years still exists. Many of the edits made in Main are grammar corrections and other small tasks, so it makes sense that it would take less time to do more edits. It is also interesting to note that the differences from first year to second year are not as great in time proportions as they are in edit proportions. An explanation for this is that users are gaining experience after their first year, and it becomes easier to do larger amounts of work in less time.
With regards to average proportion of edits in Project, for each cohort there is an immediate decrease after the first year and then an increase during the later years. This is most likely due to Sandbox, the area where new users can go to practice editing. The activity in this area would go down after a year of editing, since users would have likely gained enough experience. The rise in later years of each cohort is probably due to experienced users giving more input into rules and guidelines. Regarding time proportion, the curves follow the same trend but are higher in general compared to edits. This means that work in Project takes more time than in other namespaces.
Both the edits and time data for Talk shows a decrease in proportion not within each cohort, but overall. After each cohort's first year, the proportion is generally stable, but each new cohort's curve appears below the last. This was unexpected, and we have no explanation for why Talk appears to be decreasing in popularity with each new group of users. The graphs share this property; it does seem that, in general, it takes more time to make an edit in Talk.
Work by Tenure
[edit]After examining raw edits and hours, the proportions, and user averages, we wanted to see who was doing how much of the work. We thought it would be beneficial to view a breakdown by tenure for each cohort and namespace.
Realizing that an edit made in December and then another made in the following January did not exactly constitute a full year, we decided to use a more accurate calculation of offset. Instead of solely looking at the year of edits, we defined offset by the actual date. For example, consider a user whose first edit was made on 7/15/04 and whose second edit was on 4/3/05. We would have originally considered the offset year of the second edit to be 1, but for the purposes of our tenure analysis, the offset is 0. For that user, the offset will be 1 for any edit made between 7/15/05 and 7/15/06 (not including 7/15/06). Specifically, for a certain cohort and namespace, we plotted the number of edits by offset year for each tenure group.
Another problem is that we do not have the complete database for 2012. Suppose a user had his first edit in 2004 and his last edit in 2012. Using this method, more users would be grouped into tenure 7, instead of tenure 8, even though they made many edits in 2012. Hence we took the two longest tenure groups and merged them together. In this case, tenures 7 and 8 got merged together into tenure 7+.
We made one graph for each namespace and cohort year, and each curve represents one tenure group.
Again, edits and time decrease over time in each tenure. We noticed that users who stay longer make more edits and spend more time, and users who are still active in wikipedia today made the most edits and spent the longest time from the beginning. This enhances the GroupLens argument by Panciera et al. that "Wikipedians are born, not made."
Clustering User Activity
[edit]Motivation
[edit]While modeling edit activity through aggregated edit counts, proportions, and durations gives us some insight to Wikipedia users' activity, they do not give us enough information about individuals to concisely see work trends as users age. We sought a less vague, more holistic view of common work archetypes that would give us simpler insight to how users' activity changes as they mature as editors. For example, when users enter Wikipedia, they probably contribute only to article content. As they gain experience and are socialized into the community, how often do they focus their efforts towards more administrative roles, such as organizing WikiProjects? We hypothesized that we would identify a few common work archetypes; one would be editing article content in the Main namespace, and the others would be more maintenance, organization, and administration oriented tasks. We expected that as users accrue tenure (i.e. participate on the site longer) that they would shift from this first Main work archetypes towards others.
Methodology
[edit]The amount of edits across all in-use Wikipedia namespaces is the data we looked at to determine work archetypes. A problem with this model, however, is that for most editors it is sparse; very few users edit namespaces other than Main, Talk, User, and User Talk. We worried additionally that the disproportionate activity of power users (such as Koavf) would unduly influence the model. To mitigate these problems, we used Latent Dirichlet Allocation (LDA) to build our model. LDA is designed and mostly used for identifying topics in large corpora of text data. A data vector for each document in a corpus is made up of counts of each word in the corpus as they appear in that document; as a result, document data vectors are very sparse, and can vary as wildly in their relative magnitudes as text document lengths. However, LDA does not make any suppositions about data vectors being derived from text, so it works for any data set that can be represented as 'word counts'.
In our case, a 'word' is a namespace, and a 'word count' is a count of edits to that namespace. Our 'documents' are the edit counts for one year of a user's activity editing, referred to as a user-year; that is, a count of edits by namespace for a single user's first offset year of editing, second offset year of editing, for all years that they edit, make up multiple 'documents' for a single user. Our corpus is all of the editing activity of all users on Wikipedia during the time frame our research looks at (2003 to 2012). We look to identify 'topics' in this corpus, which in our case are common work archetypes. In summary, we have a data vector for each user and each offset year they have been active, that is made up of twenty counts of edits to the twenty used namespaces in Wikipedia during that year of editing for that user. We sampled about a hundred thousand of these data vectors with more than ten total edits, distributed proportionally to amount of total edits made during their absolute years, to create our model using Daichi Mochihashi's C implementation of LDA topic estimation.
We created LDA models of sizes three through ten to identify a 'best' model. In our case, a best model needed to be both easy to understand, and concise in that it did not draw distinctions between very similar work archetypes, or overfit to archetypes that did not represent actual work. The model over seven archetypes best met these criteria, as the larger models began to contain redundant or very unlikely work archetypes, and the smaller models grouped dissimilar work archetypes together.
After this model was created, we computed the marginal distribution for each user-year, given the beta parameters' distribution created by LDA for each work archetype, giving us a likelihood distribution for each user-year being identified into each archetype. This distribution is derived from repeated iteration for each archetype of the Dirichlet-multinomial marginal distribution.
Where
is a data vector of edit counts in namespaces for a user-year,
are the beta parameters for a single archetype, and
are the simple magnitudes of the and vectors. denotes the beta function.
We selected the maximum marginal likelihood from this distribution for each user-year to classify them. This distribution and classification ignores the alpha distribution of Dirichlet priors, which determine the likelihood of an arbitrary user to be identified with an archetype to more easily interpret the results. The user classifications were then compiled by our various methods of grouping users, including by offset year, absolute year, user tenure, user cohort, and by user tenure together with offset year.
Model
[edit]Below are graphical and numeric representations of the model over seven archetypes created by LDA from our sample. The alpha parameters describe the distribution of archetypes over the corpus of user data, and the beta parameters describe the distribution of namespace edit counts over the archetypes. In addition, we qualitatively describe each work archetype by its characterization in the model. The nicknames we apply to each archetype are general descriptions of the activity represented by namespace presence, and do not in all cases accurately describe the activity of user-years classified into their respective archetypes.
- Main Archetype is easily described as users who have almost exclusive presence in the Main namespace, which contains encylopedia article content. This archetype likely represents the large majority of users who make a small amount of edits to article content and make no other contribution, as evidenced by the high concentration parameter for this archetype in the alpha parameters. We nickname this archetype after its obvious namespace presence.
- Encyclopedia Organization is characterized by significant presence in the Main, File, Template, Template Talk, and Category namespaces. This archetypes, and all others numbered after it, have much smaller concentration in their prior distributions in the alpha parameters, indicating that they make up a smaller amount of or less uniform activity. This archetype likely represents activity that helps to organize the format and layout of the encylopedias, including editing page templates and Category directories of other pages.
- Article Maintenance is characterized by significant presence in the Main namespace and by majority presence in the Talk namespace. This archetype has the second highest concentration for the prior distribution in the alpha parameters. This archetype likely represents activity in article editing that involves discussing the appropriate or necessary content of articles, and making edits to those articles discussed to help them conform to Wikipedia standards surrounding content quality and format. For example, the activity of users who watch for low-quality contributions to high-traffic articles and revert them would fall into this archetype.
- WikiProject has similar presence in the Main namespace to that of 'Article Maintenance', but has majority presence in the User Talk namespace and noticeable presence in the Project namespace. The activity of this archetype is likely that of organizing WikiProjects, coordinated efforts of editors with experience or domain expertise to create improve articles categorized in a specific domain. The reasoning for this description is a large portion of WikiProject activity is dedicated to editing articles and coordinating with other editors, and that WikiProjects share the Project namespace with pages on Wikipedia guidelines and policy.
- User Archetype has almost exclusive presence in the User namespace, which contains pages for users to describe themselves or others. The activity of this archetype is likely of users editing their own user pages, an important part of socialized users developing a public identity on the site (user pages of some of the most active users are longer than many encyclopedia articles).
- Policy and Guidelines has majority presence in the Project namespace and significant presence in the Project Talk namespace. Given that the Project namespace contains pages for Wikipedia policy and guidelines for editing Wikipedia pages, in addition to the relatively small presence in the Main namespace, it is likely that this archetype describes the activity of those who participate in editing and discussing policy and guideline pages.
- Site Organization has large presence in the Category Talk namespace, significant presence in the Talk and Template Talk namespaces, and some presence in the Main, File Talk, Category, and Portal Talk namespaces. The combination of little presence in content namespaces and majority presence in talk namespaces leads us to believe this archetype represents the activity of discussing the organization of the site as a whole.


| Main Archetype | Encyclopedia Organization | Article Maintenance | WikiProject | User Archetype | Policy and Guidelines | Site Organization |
|---|---|---|---|---|---|---|
| 1.7564836e+00 | 1.1854994e-01 | 1.9986273e-01 | 1.5641847e-01 | 1.6830553e-01 | 1.0783288e-01 | 1.9369270e-02 |
| Namespace | Main Archetype | Encyclopedia Organization | Article Maintenance | WikiProject | User Archetype | Policy and Guidelines | Site Organization |
|---|---|---|---|---|---|---|---|
| Main | 9.9981764e-01 | 3.6899085e-01 | 1.2537390e-01 | 1.3811529e-01 | 6.6558976e-03 | 2.5417490e-02 | 2.2496693e-02 |
| Talk | 2.6730422e-05 | 1.3406987e-03 | 8.5734330e-01 | 2.6228271e-03 | 7.9232646e-05 | 1.6008920e-02 | 1.3907867e-01 |
| User | 5.0553611e-05 | 2.6174330e-04 | 8.3832267e-04 | 1.6819727e-03 | 9.9085192e-01 | 2.3388940e-03 | 4.7282105e-04 |
| User Talk | 1.2014141e-05 | 9.3888715e-04 | 4.4915261e-03 | 8.3038669e-01 | 1.7200684e-03 | 1.1606439e-02 | 4.8154162e-04 |
| Project | 1.0117360e-05 | 5.3181036e-04 | 9.0215793e-04 | 2.6449248e-02 | 2.5185938e-04 | 7.5261817e-01 | 1.3907877e-03 |
| Project Talk | 5.4614818e-07 | 1.1910877e-03 | 8.6797537e-03 | 6.2459673e-05 | 3.1699855e-05 | 1.4618528e-01 | 5.4752941e-05 |
| File | 1.6581085e-09 | 1.4536981e-01 | 2.6098975e-07 | 3.9726205e-06 | 1.0788325e-05 | 3.6728207e-07 | 1.9855893e-07 |
| File Talk | 1.4330291e-07 | 2.1669527e-03 | 6.9750566e-04 | 7.2516831e-05 | 1.4708854e-05 | 7.1915262e-05 | 1.7345331e-02 |
| MediaWiki | 4.2037181e-17 | 6.8376116e-12 | 9.9318001e-19 | 8.9132609e-06 | 1.0688244e-14 | 1.6211061e-03 | 2.9305970e-29 |
| MediaWiki Talk | 1.5475947e-13 | 6.8920102e-06 | 5.8569758e-14 | 2.8162898e-04 | 1.6442756e-06 | 1.8292871e-03 | 6.9854840e-28 |
| Template | 1.0374316e-07 | 2.7942859e-01 | 5.1404187e-06 | 1.1126099e-06 | 3.8207228e-07 | 2.6154317e-04 | 1.0049155e-04 |
| Template Talk | 2.9783693e-07 | 2.5018055e-02 | 1.5914544e-03 | 4.0382060e-05 | 3.8980154e-05 | 8.0729963e-03 | 1.1736077e-01 |
| Help | 1.8837148e-05 | 1.5569140e-04 | 2.7123410e-06 | 2.1766299e-04 | 1.3772547e-04 | 5.3185030e-04 | 1.3555400e-14 |
| Help Talk | 2.9498134e-06 | 9.4394514e-06 | 6.1012016e-05 | 5.3640058e-05 | 6.3429164e-05 | 3.4162303e-04 | 1.4737346e-12 |
| Category | 1.2217317e-11 | 1.7418736e-01 | 3.8052860e-09 | 2.9178753e-13 | 9.0691631e-16 | 2.3790721e-08 | 1.9562990e-02 |
| Category Talk | 7.1033565e-20 | 2.1238678e-15 | 2.8216298e-21 | 5.2110842e-18 | 4.5759516e-24 | 3.7861285e-16 | 6.6337049e-01 |
| Portal | 5.9860953e-05 | 3.6773187e-04 | 1.3897480e-06 | 4.9014997e-08 | 1.0546037e-06 | 3.1773134e-02 | 4.4170272e-04 |
| Portal Talk | 1.7047572e-10 | 2.0444254e-08 | 2.2167492e-06 | 1.6241282e-06 | 4.5527189e-08 | 1.0909991e-03 | 1.6321725e-02 |
| Book | 1.9979593e-07 | 3.2665076e-05 | 1.1108232e-06 | 1.4219752e-12 | 1.3843680e-04 | 1.3794468e-04 | 1.4457641e-03 |
| Book Talk | 3.4542605e-13 | 1.7105668e-06 | 8.2374464e-06 | 1.7679617e-08 | 2.1237646e-06 | 9.2022828e-05 | 7.5264694e-05 |
Archetype Statistics and Lifecycle
[edit]To derive a detailed description of the changing nature of work in Wikipedia over its lifetime and the lifecycle of its editors, with respect to our LDA model, we compile statistics about user inference under the model over time. Proportions of user classifications into hard clusters based on maximum likelihood identification into their corresponding work archetypes (soft clusters) were organized by the user grouping schemes we had used so far, specifically:
- Offset year that user-years took place in (e.g. 0, 1)
- Absolute year that user-years took place in (e.g. 2004, 2005)
- Cohort of the user (e.g. 2004, 2005)
- Tenure of the user (e.g. 0, 1)
- Offset year that user-years took place in, separated by tenure of the user and whether the users are active
Offset Year of User-Year
[edit]This graph represents the proportion of classification of user-years into our model's archetypes, plotted by the offset year that the user-year took place. As a result, there are many more users in the proportions in early offset years (i.e. offsets 0, 1) than there are in the proportions of later offset years (i.e. offsets 8, 9), since all users are present in offset year 0 and many stop editing and leave the site between then and now (2012, offset 9) and therefore have no representation for those later offset years. This graph shows a moderate but clear trend of the proportion of users in the Main Archetype and User Archetype clusters shrinking, by roughly 0.2 and 0.06 respectively. All other archetypes increase in size by about 0.1 over the course of all offset years.
This representation would initially appear to support our hypothesis that as users accrue tenure, they focus their efforts away from article editing towards administrative tasks. However, because the offset year buckets contain numbers of user-years that vary wildly, this effect could as easily be caused by low-tenure users dying out as by users changing their work habits.

Absolute Year of User-Year
[edit]When plotted by the absolute year the user-years took place, we see instead that the proportion of users in the Main Archetype increases starting in 2005 and 2006, and peaks in 2010, growing by about 0.2 in total. This corresponds with the exponential growth of the user base that took place around this time period, assuming most of these users made few edits to namespaces other than Main; the drop in proportion in this archetype in 2011 also corresponds with the start of the user base decline at this time period.[2]
It is important to note, however, that the proportions here do not represent actual edit activity, but only the users active during this period. Previous research has shown that the proportion of activity in the Main namespace to that in the Talk namespace shrank dramatically during this time,[3] which our work in the sections above confirms. Our results confirm our intuition that despite this change in editing activity, a large portion of the users that year did not significantly contribute to the site as a whole and primarily have a presence in Main. This could also be an artifact of the particular work archetypes our model recognizes.

Cohort of User
[edit]Archetype proportion plotted by user cohort shows roughly the same trend. The most notable exception from the plot by year is the increased presence of the Main archetype in the year plot. This makes sense when considered that the encyclopedia has signficantly less content in 2003 than it does now, and the 2003 cohort had turned their attention to other work archetypes since then. Here, all user-years for a single user are put into the bucket that corresponds to the cohort for the user. It also makes sense that this plot is strikingly similar to the plot by year as the majority of users who edit in a given year are in that year's cohort.

Tenure of User
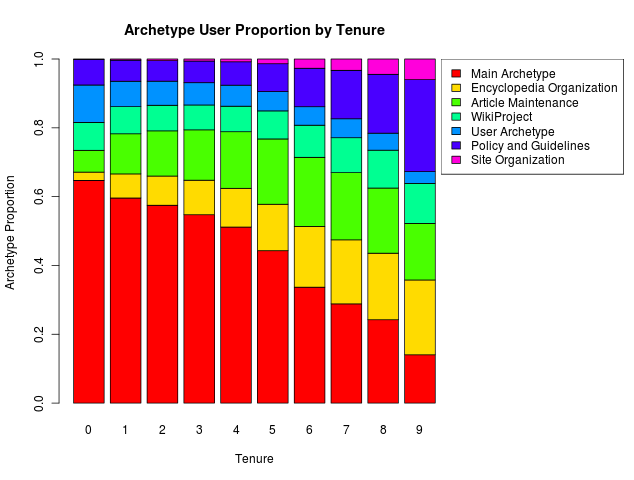
[edit]When plotted by user tenure, we see a much more dramatic version of the trend in the plot by offset. Every archetype proportion either stays constant or increases by at least 0.1 except for the Main and User archetypes, which decrease by about 0.5 and 0.1 respectively. Overall this is unsurprising and consistent with the general idea of our hypothesis going into this, which is that users who stick around longer or have been involved with the site since its early period are more likely to take on administrative work. However, this plot also has vastly different numbers of users in the different buckets, again since most users do not survive very long and only a very small amount survive to the higher tenures shown here.
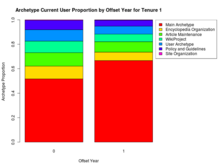
Offset Year of User-Year, by Tenure of User
[edit] |
 |
 |
 |
 |
 |
 |
 |
 |
 |
 |
 |
Limitations
[edit]The most salient shortcoming of our clustering methodology is that it depends entirely upon categorizing work by namespace edits. If a user is patrolling for vandalism, for instance, and he or she is not significantly editing any other namespace during that year then his or her reverts to vandalized articles are indistinguishable from those users that make only a few edits to articles and leave the site under our model. This is an artifact of both our particular clustering approach, and of the way we represent user activity. The latter also applies to situations where activity in namespaces is genuinely ambiguous; the Project namespace (aliased as Wikipedia), for example, holds pages for both WikiProjects and for site policy. These very different activities cannot be distinguished from one another under our model, and it is only through edits in other namespaces in the archetypes where this namespace is present can we make guesses about which of these tasks is being done by a user.
In the process of turning the inferred soft clustering of distribution over work archetypes into hard clustering through classifying users by maximum likelihood, we also lose some information about work done in other archetypes, as one archetype gets all the credit for a user, even if other archetypes are slightly less likely. Similarly, the downside of choosing LDA to avoid power users unfairly biasing the model is that we cannot draw meaningful inference about the relative magnitude of users' activity with it; in this sense, our work archetype clustering results are not really representative of the overall work done on the site, just of the users doing it.
Additional Analyses
[edit]New Users and First Months
[edit]We briefly investigated monthly trends for new users by cohort. By plotting the number of new editors divided into cohorts for each month of their entry year, we saw that there existed three distinct trends for new users: a trend for those who entered in 2001, 2002, 2003, or 2004, a trend for those who entered in 2005 or 2006, and a trend for those who entered in 2007 or later. The first group (cohorts 2001, 2002, 2003, and 2004) had a relatively stable number of new users each month of the entry year. The second group (cohorts 2005 and 2006) displayed a trend of great increase in new users between January and December of the respective start year. The last group (cohorts 2007, 2008, 2009, 2010, and 2011) exhibited a trend of fluctuation but general decrease between January and December; some months obtained more new members than others, but for each cohort, December had less new members than January.

Related Work
[edit]Throughout the past years, researchers have examined many aspects of Wikipedia and its contributors. Preece and Shneiderman outline how online users move between four different types of participation: reader, contributor, collaborator, and leader.[4] A typical user first simply reads social media. Later, he or she might make brief contributions to the media, such as uploading pictures or videos, and perhaps engage in communication with other users. Finally, some users may even feel so inclined as to encourage more participation from others and take part in governing activities. We generalized this framework for users in Wikipedia and hypothesized that if beginning contributors offer small changes to social media, then perhaps first-time editors mostly edit to Wikipedia main articles.
Focusing solely on Wikipedia, Panciera et al. claim that the majority of work accomplished on Wikipedia stems from a small portion of the editors.[1] Labeled "Wikipedians," these users, when compared to "non-Wikipedians," do much more of the work from their very first edit. Our analyses dealing with tenure supports these findings, as discussed above.
References
[edit]- ↑ a b Panciera, Katherine; Halfaker, Aaron; Terveen, Loren (2009). "Wikipedians Are Born, Not Made: A Study of Power Editors on Wikipedia" (PDF). Proceedings of the ACM 2009 international conference on Supporting group work (ACM): 51–60. doi:10.1145/1531674.1531682. Retrieved May 2009.
- ↑ Halfaker, A.; Gieger, R. S.; Morgan, J.; Riedl, J. (2013). "The Rise and Decline of an Open Collaboration System: How Wikipedia's reaction to sudden popularity is causing its decline". American Behavioral Scientist. doi:10.1177/0002764212469365. Retrieved 7 August 2013.
- ↑ Kittur, Aniket; Suh, Bongwon; Pendleton, Bryan A.; Chi, Ed H. (2007). "He Says, She Says: Conflict and Coordination in Wikipedia" (PDF). Proceedings of the SIGCHI Conference on Human Factors in Computing Systems. CHI '07 (ACM): 453–462. ISBN 978-1-59593-593-9. doi:10.1145/1240624.1240698. Retrieved 7 August 2013.
- ↑ Preece, Jennifer; Shneiderman, Ben (2009). "The Reader-to-Leader Framework: Motivating Technology-Mediated Social Participation" (PDF). AIS Transactions on Human-Computer Interaction 1 (1): 13–32. Retrieved March 2009.


